Enterprise merchants lose between 9% and 20% of annual revenue to payment failures (industry composite, 2025). The harder problem: most finance teams find out a week after it started. A single authorization rate number on a dashboard is not the same thing as understanding why that rate moved, where it dropped, and which transactions are recoverable. Payment analytics performance work starts when you stop watching one blended metric and start reading the signals underneath it.
Key Takeaways
- Authorization rate is a P&L metric. A 3-percentage-point drop on one acquirer in one market can represent seven figures in annual lost revenue for a high-volume merchant.
- Blended authorization rates hide per-route variance. Yuno's platform data shows 8% average authorization rate uplift when smart routing replaces static acquirer assignment across enterprise merchants (Yuno platform data, 2026).
- Soft declines and hard declines require different responses. Mixing them into a single "decline rate" metric makes both unactionable.
- Multi-PSP merchants cannot compare provider performance without a neutral layer normalizing the data. Each PSP defines metrics differently.
- Real-time monitoring closes the detection gap. Approval rate drops that take 24 hours to surface in batch reporting generate hours of unrecovered revenue loss.
Why Authorization Rate Is a Finance Metric, Not a Gateway KPI
Authorization rate measures the share of submitted transactions that issuers approve, and every missed percentage point is direct revenue leakage to the P&L. Most gateway-level reporting aggregates this into a single blended figure, which hides the variance that finance teams need to act on.
The problem with a blended rate is the denominator. A 91% authorization rate looks fine until you segment it. One card network in Germany might sit at 96%. A specific BIN range from a UK-issued Visa on a cross-border transaction might sit at 74%. The average looks healthy; the underlying P&L impact is not.
We've seen this pattern repeatedly across enterprise merchants integrating onto Yuno's infrastructure. A head of payments runs a multi-PSP stack, pulls a weekly report, and sees authorization rate holding steady. What they are not seeing is that one acquirer has degraded on a specific card type, and another acquirer would have approved those transactions at a 12-point higher rate. The blended number masks both signals.
For finance teams, the metrics that actually move revenue are not the ones most dashboards surface by default. Authorization rate needs to be segmented by acquirer, card network, BIN range, and geography before it becomes actionable.
What Payment Analytics Performance Dashboards Should Actually Show
A payment analytics performance dashboard earns its place when it narrows the gap between something going wrong and a decision being made about it. Most dashboards report on what happened; the useful ones surface why it happened and what to do next.
The metrics that belong in an enterprise payment dashboard fall into five categories.
Authorization rate by acquirer and card network
Segment authorization rate at the acquirer level, then cross-cut by card network and BIN geography. This surfaces the per-route performance gaps that a blended rate hides. For merchants running two or more acquirers, this comparison is the starting point for smart routing decisions.
Soft-decline rate and retry success rate
Soft declines are recoverable. Hard declines are not. Mixing them into a single decline rate makes both unactionable. A well-structured dashboard tracks soft-decline volume separately and shows the retry success rate for each decline code. Issuer response codes like "insufficient funds" or "do not honor" have meaningfully different retry success rates and require different handling logic.
False-decline rate
False declines are issuer-side rejections of legitimate transactions. They are identifiable when a customer with no fraud history receives a hard decline on a card in good standing. False declines cost merchants approximately three dollars in lost revenue for every one dollar in processing fees (Optimus, 2026). A dashboard that does not surface false-decline rate separately is leaving a recoverable revenue line invisible.
Approval rate by geography and payment method
Authorization rates vary materially by market. A merchant processing iDEAL in the Netherlands alongside card transactions in the UK needs geographic segmentation to see which rails are performing and which are dragging the average. Payment method mix also matters: digital wallets, bank transfers, and card networks each have different issuer-side approval dynamics.
Provider latency and downtime correlation
Authorization rate drops do not always reflect issuer behavior. Sometimes a PSP is degrading, and transactions are timing out before they reach the issuer. A dashboard that tracks provider response latency alongside authorization rate separates issuer-side declines from infrastructure-side failures. These require completely different responses, and a dashboard that conflates them delays both.
How Multi-PSP Merchants Lose Visibility (and Revenue) in Reporting
Every PSP defines authorization rate differently, which means that comparing performance across providers from their native dashboards produces numbers that are not comparable. One provider includes retries in the denominator; another excludes them. One counts 3DS abandonment as a decline; another does not.
This is the normalization problem, and it is the most common reason payment analytics performance work stalls at enterprise merchants. Finance teams end up reconciling discrepant numbers from multiple dashboards instead of making routing decisions.
In our integrations across financial services, marketplace, and subscription verticals, this is one of the first operational gaps we address. Yuno's platform normalizes transaction data across all connected providers before it surfaces in reporting. That means a comparison between two acquirers on the same BIN range is an apples-to-apples comparison, not a methodological artifact.
Only a neutral layer with no stake in which provider wins the routing decision can make that comparison credibly. Yuno owns no rail and sells no acquiring. Every routing recommendation and every performance comparison reflects actual transaction outcomes, with no conflict of interest built into the analysis.
Real-Time Monitoring Versus Batch Reporting: Where Revenue Is Lost
The detection gap between an authorization rate event and a human response is where most recoverable revenue is lost. Batch reporting surfaces issues in 24-hour cycles; real-time monitoring closes that to seconds.
Consider what happens when an acquirer degrades on a Thursday afternoon. Approval rates drop 8 points on that provider's traffic. In a batch-reporting environment, the head of payments sees this on Friday morning review. Eight to twelve hours of degraded traffic have already processed. In a real-time monitoring environment with automated rerouting, the degradation is detected in seconds and traffic shifts to a healthier provider before the next transaction arrives.
A large on-demand delivery platform we work with reduced its payment issue response time from minutes to seconds using Yuno's Monitors module. The practical effect was an 80% reduction in analyst time spent on disruption resolution, and a significant decrease in transaction failure rate during provider incidents.
The mechanics matter here. Yuno's Monitors let payment operations leads define custom thresholds by provider, country, currency, card brand, or volume. When a threshold is breached, the system alerts via Slack or email and automatically reroutes traffic to healthier providers without requiring a human to log in and make a change. When the provider recovers, traffic returns to normal routing. The human team handles the post-incident review, not the incident itself.
For finance teams, this translates directly: incidents that previously leaked an hour of transaction volume now leak seconds. The revenue difference at high transaction volumes is material.
How Smart Routing Lifts Authorization Rates Across Markets
Smart routing selects the optimal acquirer for each transaction based on card type, geography, amount, and real-time provider performance. Static routing assigns transactions to acquirers based on fixed rules that cannot adapt to live performance signals.
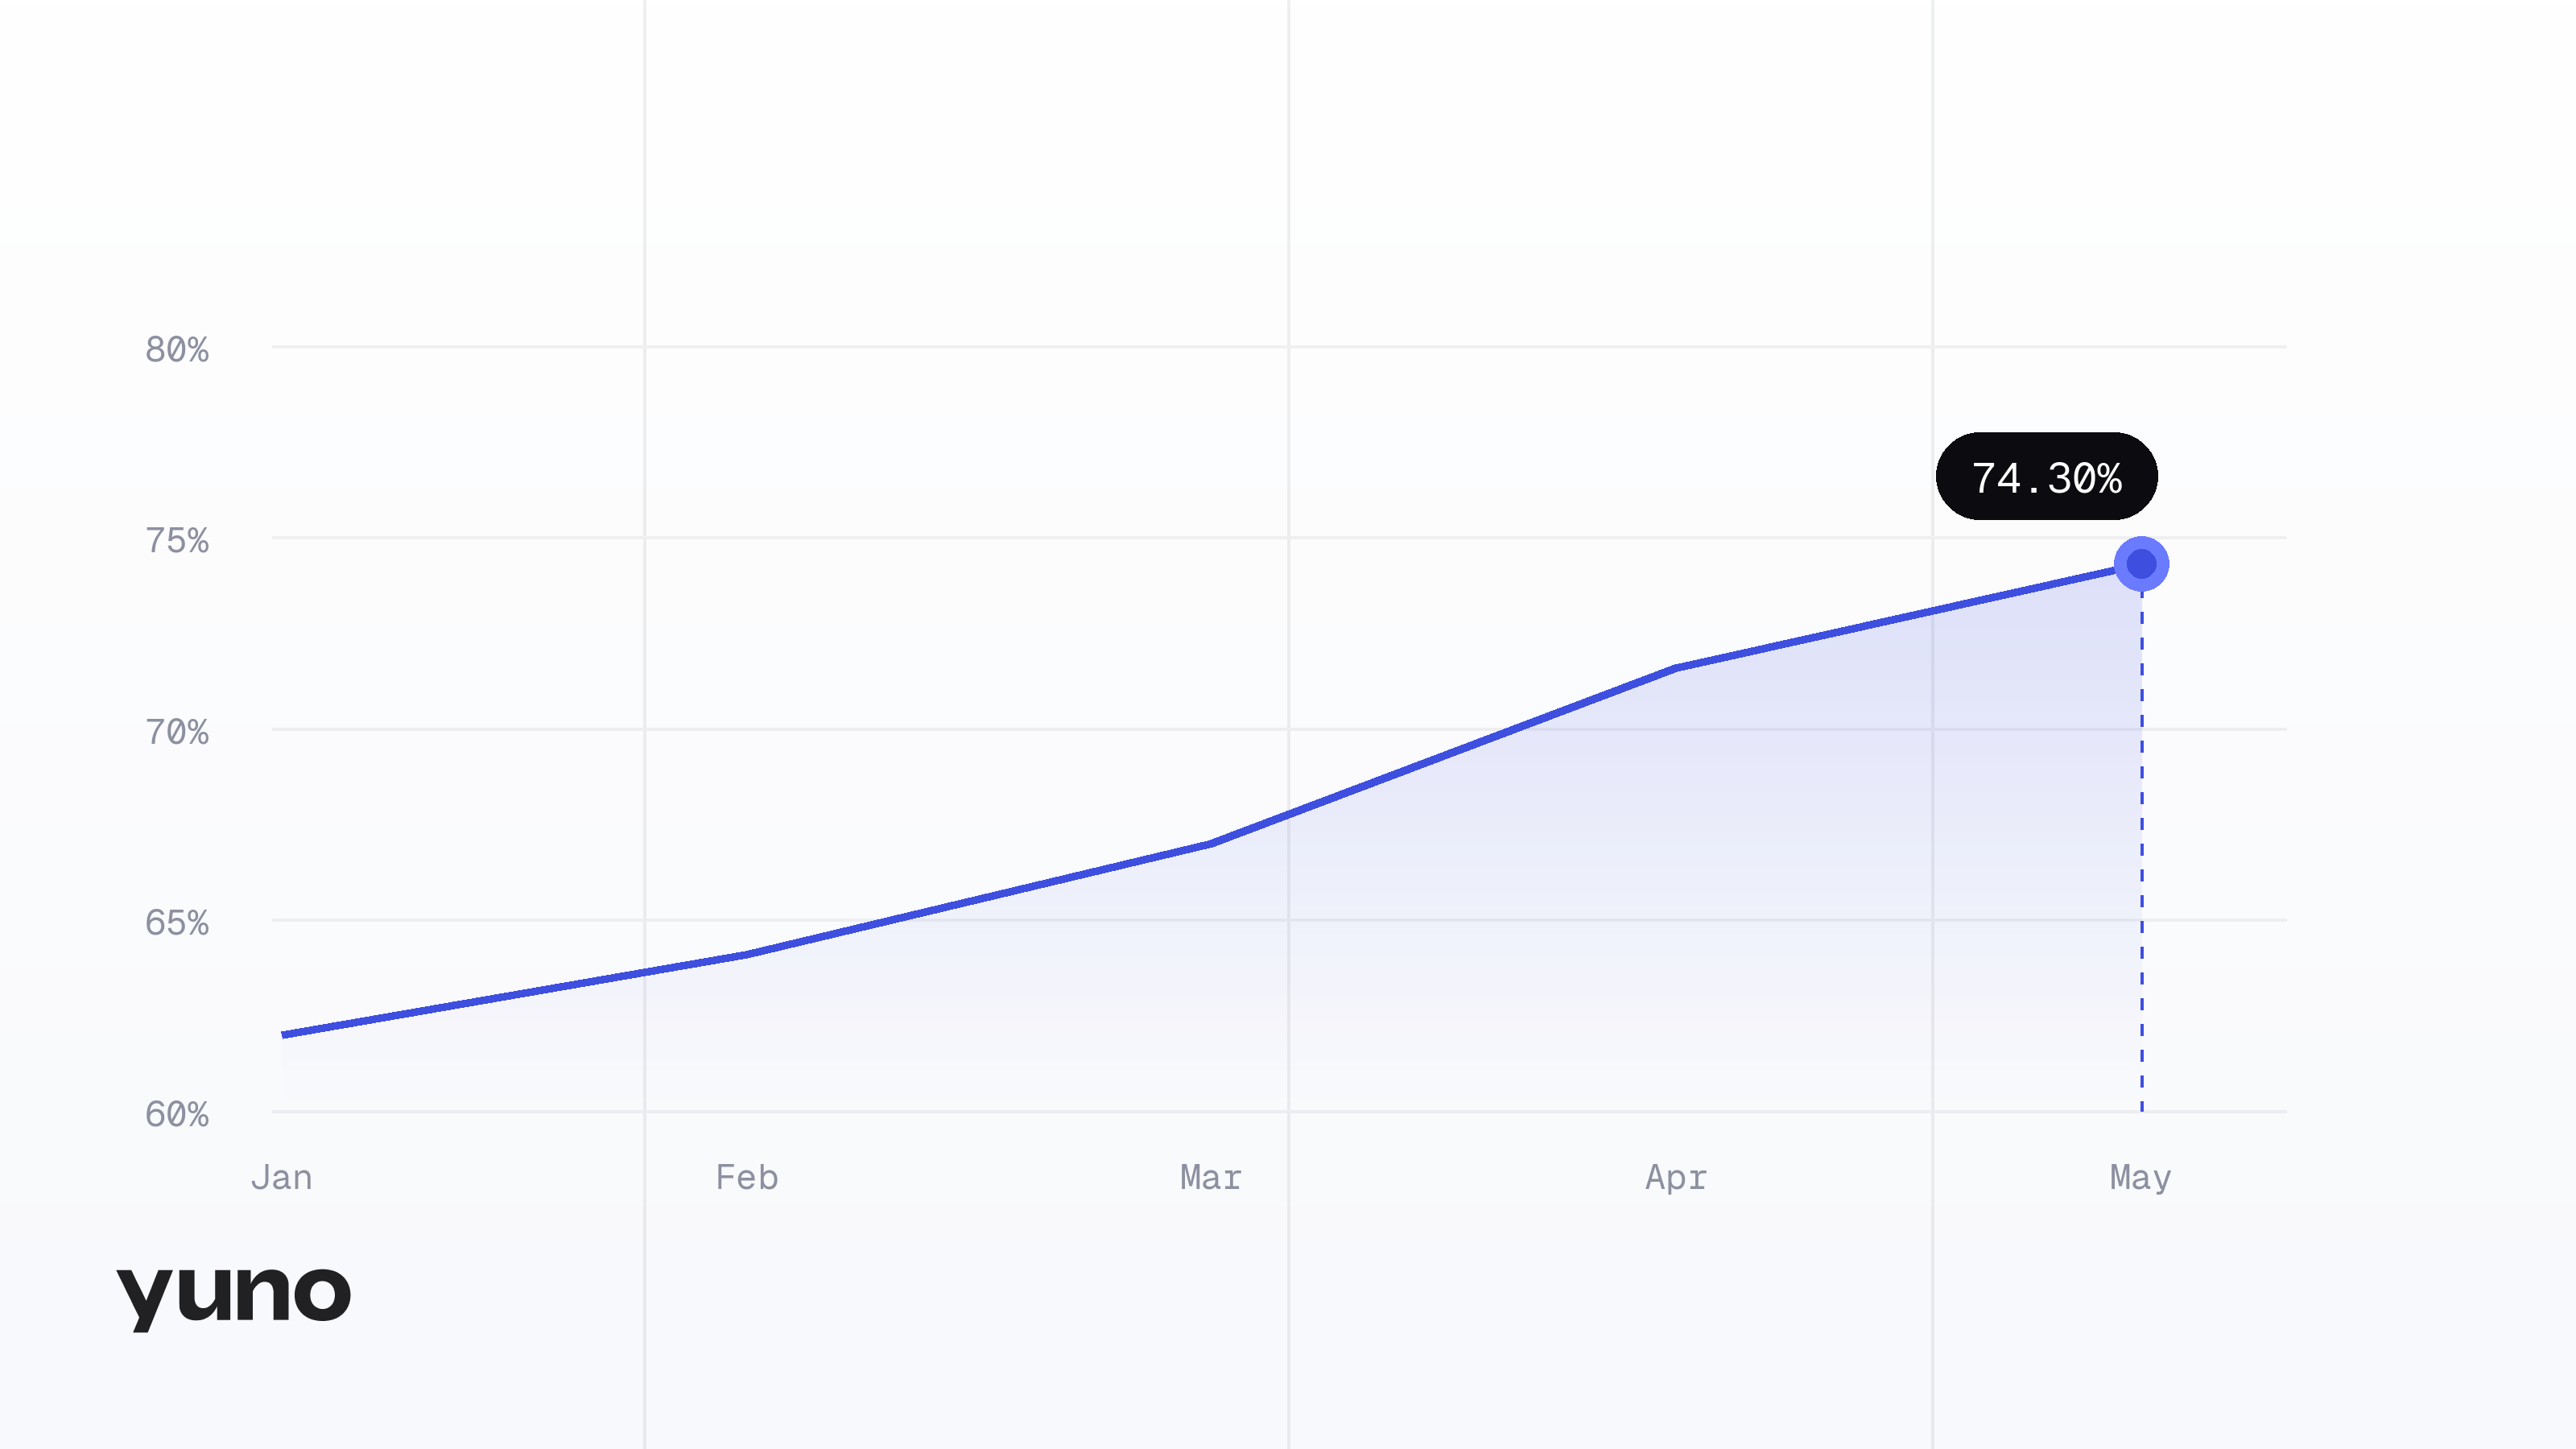
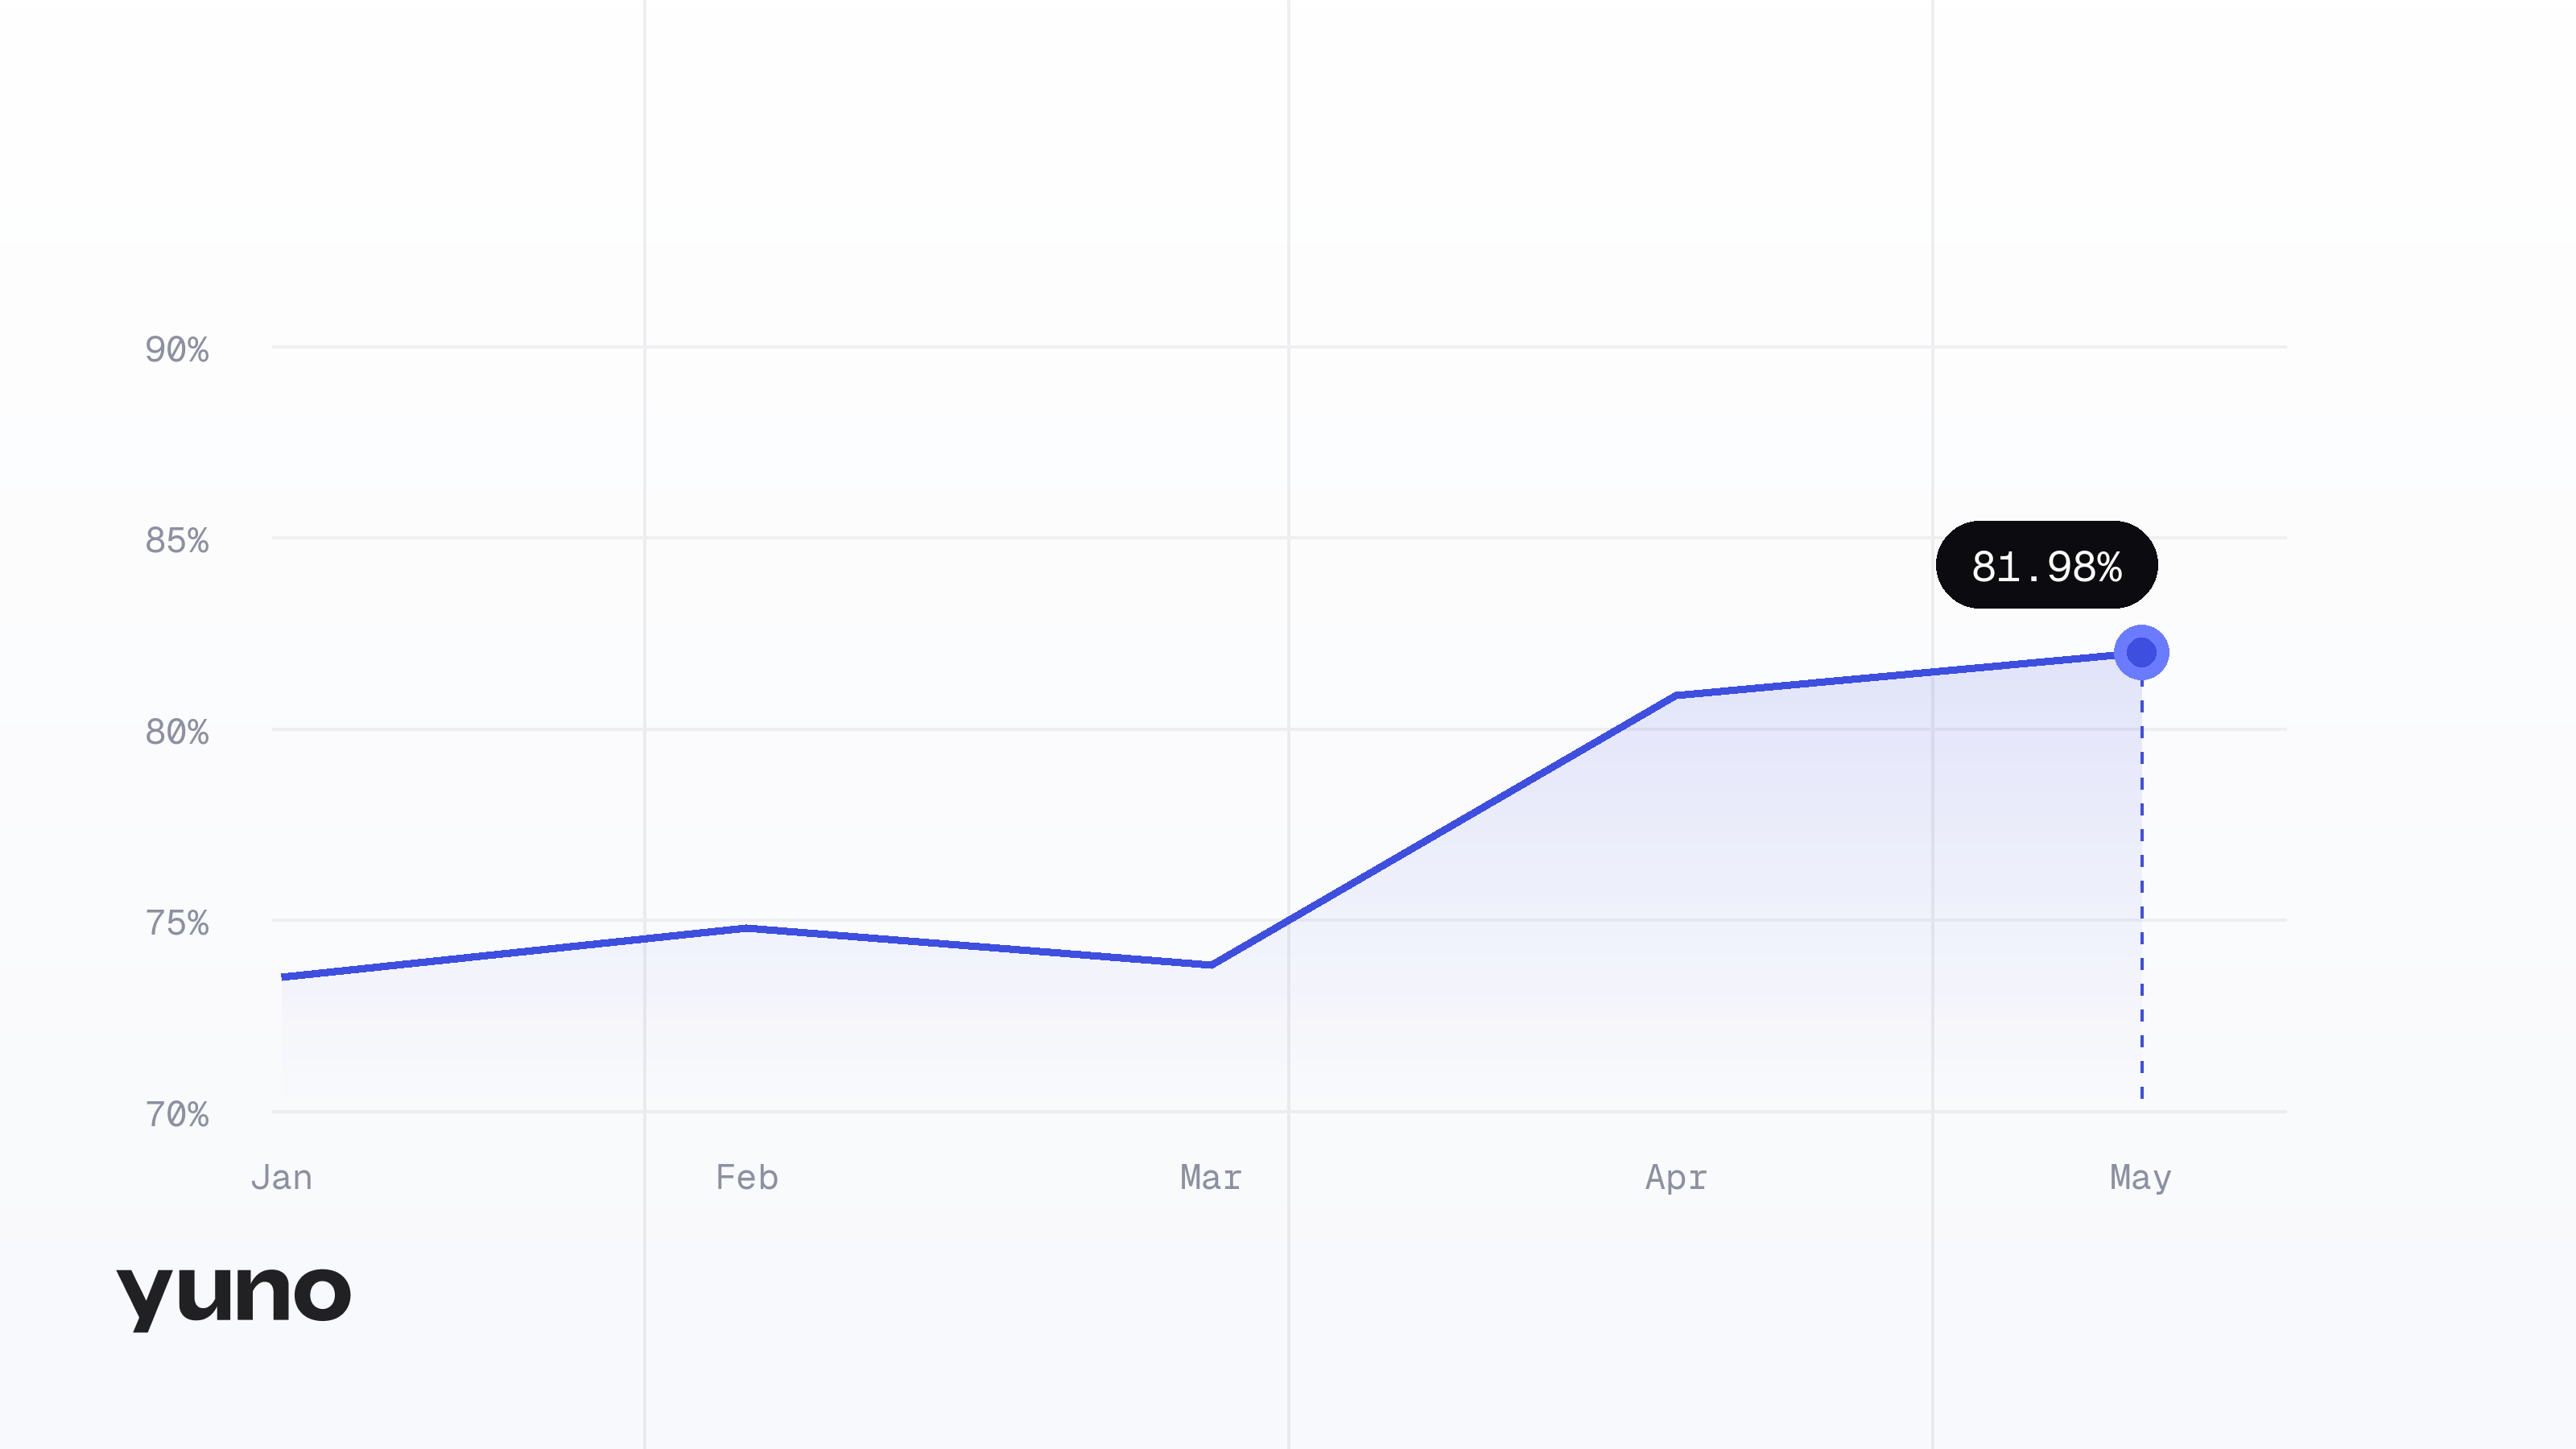
The authorization rate impact of moving from static to smart routing is one of the clearest measurements in payment analytics performance. Yuno's platform data shows an 8% average authorization rate uplift across enterprise merchants when smart routing replaces static acquirer assignment (Yuno platform data, 2026). That figure comes from aggregated transaction outcomes across our infrastructure, not from a modeled projection.
The mechanism is straightforward. A transaction from a UK-issued Mastercard processed through an acquirer with strong UK Mastercard relationships will approve at a higher rate than the same transaction routed to a generic global acquirer. Smart routing makes that decision dynamically, for every transaction, using real-time performance data. Static routing makes that decision once, at integration, and never updates it.
For heads of payments evaluating authorization rate improvement strategies, the routing layer is the highest-leverage starting point. It requires no changes to the checkout experience and no new PSP integrations. It operates on the existing provider relationships the merchant already has, and directs volume toward the one most likely to approve.
Recovering Revenue After Authorization Fails
Failed transactions are not all final. Soft declines are recoverable with intelligent retry logic; involuntary churn in subscriptions is recoverable with account updating; and some hard-decline scenarios are recoverable through alternative payment method routing.
Yuno's platform data shows up to 75% of failed transactions can be recovered using NOVA, the AI payment recovery agent (Yuno product data, 2026). NOVA intercepts failed payments in real time and engages customers through WhatsApp or AI voice calls in over 70 languages, guiding them through completing the transaction. It operates without engineering overhead and without manual follow-up from the payments team.
For subscription merchants, Account Updater surfaces new card credentials automatically when a stored card expires or is reissued, before the next billing cycle fails. This closes the involuntary churn gap without any customer action required.
Recovery is the back half of a payment analytics performance strategy. The front half is routing optimization and real-time monitoring. The back half catches what still falls through. A dashboard that tracks recovery rate alongside authorization rate gives finance teams a complete picture of the revenue lifecycle for each transaction cohort.
GoFundMe uses Yuno's infrastructure to process donations across multiple markets. The payment recovery capability matters acutely in that context: a failed donation is not just a lost transaction, it is a lost contribution that a donor may not retry unprompted. Recovery automation closes that gap without adding friction to the donor experience.
For finance teams who want to quantify the business case before committing infrastructure resources, the model for building a payment layer business case is a practical starting point for the internal conversation.
What the Payments Concierge Changes for Payment Operations
Payment analytics performance work breaks down when insights require a data analyst, a dashboard login, and 20 minutes of context-switching to answer a single question. The operational reality for most heads of payments is that visibility is available but not accessible in real time.
Yuno's Payments Concierge is an AI operations agent that answers payment performance questions in natural language through Slack, WhatsApp, or the Concierge interface. A head of payments can ask "which acquirer is underperforming on UK Visa transactions this week?" and receive an answer with the underlying data, the top rejection codes, and specific routing recommendations. No SQL, no analyst, no dashboard navigation.
The multi-PSP visibility is the differentiator here. No single PSP can compare its own performance against its competitors, because it only sees its own traffic. Yuno sees all of it, normalized across providers, and Payments Concierge surfaces that cross-provider analysis on demand. That is a capability that only a neutral layer can credibly offer.
The reporting output matters too. Payments Concierge generates Excel, PDF, or PowerPoint reports directly within the conversation. For finance teams preparing board-level payment performance reporting, this removes a manual production step that typically takes hours per reporting cycle.
Building a Payment Analytics Performance Layer That Finance Teams Can Use
The right payment analytics performance infrastructure serves two audiences simultaneously: the payments operations team that needs real-time granularity, and the finance team that needs P&L-level aggregation. Most dashboards serve one or neither.
From our work with enterprise merchants across subscription, marketplace, and financial services verticals, the dashboards that actually drive decisions share three structural characteristics.
- Segmentation by acquirer, card network, geography, and payment method is the default view, not a drill-down. Blended rates are for executive summary slides, not for operational decisions.
- Real-time alerts with automated response are built into the monitoring layer. Human review happens after the automated response, not instead of it.
- Recovery metrics sit alongside authorization metrics in the same view. A finance team that sees authorization rate and recovery rate together understands the net revenue outcome, not just the front-end approval rate.
Yuno's Analytics and Insights module delivers this unified view across all connected providers, methods, and markets. The Aida AI integration lets payment teams generate charts and segment views through natural language queries, without requiring a data analyst to build each report. Views are shareable and saveable, which means the head of payments and the CFO are working from the same data, formatted for their respective needs.
The practical takeaway for payment leaders: start the audit with your current authorization rate segmented by acquirer and card network. If those two cuts are not immediately available in your existing reporting, that is the gap to close first. Everything else in payment analytics performance depends on being able to see per-route performance clearly.
From there, layer in real-time monitoring with automated rerouting, then add recovery automation for the transactions that still fail. Each layer compounds on the previous one. The merchants on Yuno's infrastructure who operate all three see the authorization rate uplift, the detection speed improvement, and the recovery rate working together as a single revenue protection system, not three separate initiatives.